What Makes Debugging Embedded Systems Different
Debugging embedded systems is fundamentally different from traditional software debugging because the code runs on constrained hardware with limited visibility. There is no standard console, no desktop-level debugging environment, and often no operating system. Engineers must depend on hardware interfaces like JTAG, SWD, UART, and specialized tools to observe the system’s internal state.
Every action in firmware affects real hardware timing, interrupts, peripherals, and memory constraints, all shape the debugging approach. Issues such as race conditions, power instability, hardware faults, and peripheral misconfiguration require a mix of electronics knowledge and software analysis. This is why debugging embedded systems demands precision, specialized tools, and a structured workflow.

Debugging Embedded Systems – A Quick Overview
| Property | Description |
| Visibility | Limited, depends on tools like JTAG, SWD, UART |
| Type of Debugging | Real-time debugging, firmware debugging, and peripheral testing |
| Tools Used | ST Link debugger, Segger J Link, OpenOCD, embedded simulators |
| Challenges | Timing issues, memory limits, hardware faults |
| Skill Needed | Understanding of MCU architecture and debugging protocols |
Embedded systems require a mix of hardware and software analysis. Since they run on constrained devices with no standard console, debugging must be done through dedicated interfaces, trace logs, or simulation tools.
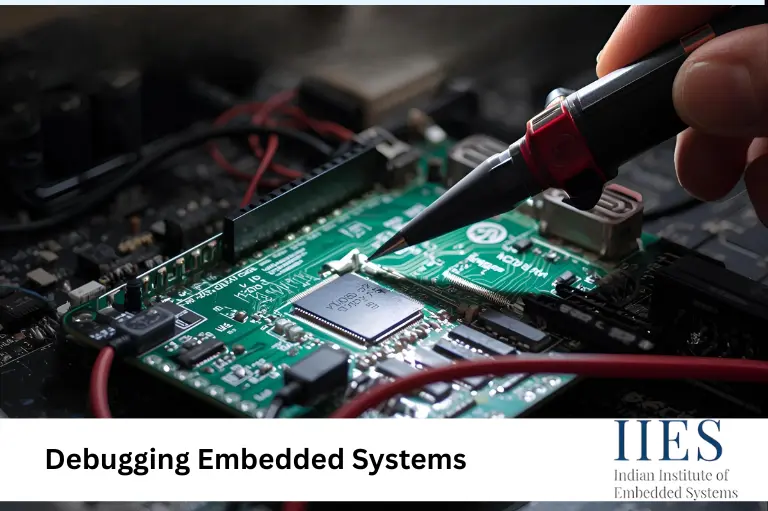
How Hardware-Level Debugging Works
Hardware-level debugging allows engineers to pause execution, inspect registers, and watch how the firmware interacts with peripherals.
JTAG Debugging and SWD Debugging
Interfaces such as SWD and JTAG provide direct access to the microcontroller for real-time debugging. Popular tools include:
- ST Link Debugger
- Segger J Link
- OpenOCD (open source option)
- Segger RTT for high-speed logging
These tools allow you to:
- Step through the code line by line
- Inspect RAM, peripheral registers, and stack frames
- Add breakpoints and watchpoints
- Track MCU behavior under different conditions
This makes them essential for MCU debugging and firmware analysis.

How Software-Level Debugging Works
Software debugging focuses on validating logic, communication interfaces, and runtime behavior.
UART Debugging and USB Debugging
A simple UART print can reveal issues that are hard to catch through breakpoints, especially in real-time applications—tools like PuTTY or TeraTerm display log output with minimal overhead.
Embedded Simulators
Simulators are useful before flashing firmware onto hardware. Options include:
- QEMU for ARM
- Renode for complex SoC simulation
- Proteus for microcontroller circuit behavior
These embedded simulators help test algorithms, peripheral configurations, and fault handling.
Proven Embedded Debugging Techniques
- Start with a Minimal Test
Check the LED blink, UART print, or GPIO toggle to confirm clock and power initialization. - Check One Module at a Time
Verify I2C, SPI, ADC, or sensor modules independently. - Use Watchdog Timers in Embedded Systems
Essential for recovery from unexpected firmware hangs. - Use Breakpoints and Watchpoints
Detect memory corruption, race conditions, and unexpected variable changes. - Real-Time Performance Analysis
Use GPIO toggles, timers, and profiling tools to measure execution times.
Practical Lessons Learned from Real Projects
- Hardware and firmware are tightly connected. Check pull-ups, wiring, and power stability.
- Race conditions cause resets and corrupted values. Use atomic access or locks.
- Compiler warnings indicate real issues like misalignment and uninitialized variables.
- Test system behavior during power failures.
- Maintain proper version control for firmware and hardware variants.
Best Practices for Reliable Debugging
- Maintain clear logging levels (INFO, ERROR, WARN)
- Keep a stable reference firmware
- Document issues and fixes
- Automate builds and tests
- Use peer review for complex debugging flows

Summary – Debugging Embedded Systems
| Area | Stack | Heap |
| Tools | JTAG, SWD, UART, simulators | OpenOCD, Segger, ST Link |
| Type | Real-time debugging | Firmware debugging |
| Use Cases | Peripheral testing, register checks | Memory checks, timing evaluation |
| Issues Found | Race conditions, hardware faults | Memory corruption, interrupts |
| Risks | MCU lockups | Slow logs, missing breakpoints |
Debugging embedded systems demands structured methods, reliable tools, and a solid understanding of real-time behavior. Using JTAG debugging, UART messages, watchdog timers, and embedded simulators makes the process efficient and predictable.
Conclusion
Effective debugging in embedded systems blends science and problem-solving. With the right mix of tools, real-time performance analysis, and experience, you can identify faults faster and build reliable firmware. Whether analyzing peripherals, testing communication buses, or performing MCU debugging, a disciplined workflow saves countless hours and prevents failures.