fbpx

How can I debug applications on STM32F407VGT6?

How can I debug applications on STM32F407VGT6?

INTRODUCTION

Debugging applications on the STM32 F407VGT6 microcontroller can be a nuanced and intricate process. This article provides a theoretical overview of the methodologies and tools essential for effectively debugging applications on this powerful 32-bit ARM Cortex-M4-based microcontroller. Understanding these concepts is crucial for developers aiming to optimize their applications and ensure reliable system performance.

I debug applications on STM32F407VGT6

1. Understanding the STM32F407VGT6 Microcontroller Architecture

Before diving into debugging techniques, it’s important to understand the architecture of the STM32F407VGT6. This microcontroller is based on the ARM Cortex-M4 core, which includes a floating-point unit (FPU), digital signal processing (DSP) instructions, and an advanced interrupt controller. These features make it suitable for high-performance applications but also introduce complexity in debugging.

Key architectural components that play a role in debugging include:

  • Nested Vectored Interrupt Controller (NVIC): Manages interrupt handling and prioritization.
  • Embedded Trace Macrocell (ETM): Provides real-time tracing of program execution.
  • CoreSight Debug and Trace technology: Allows for advanced debugging and real-time analysis.

2. Essential Debugging Tools

To debug applications on the STM32F407VGT6, developers typically use a combination of hardware and software tools. The most common debugging interfaces and tools include:

  • JTAG/SWD (Serial Wire Debug): Provides a physical connection between the development PC and the microcontroller. SWD is particularly popular for its minimal pin usage.
  • Integrated Development Environments (IDEs): Popular IDEs like Keil MDK, STM32CubeIDE, and IAR Embedded Workbench come equipped with debugging features such as breakpoints, watch windows, and step execution.
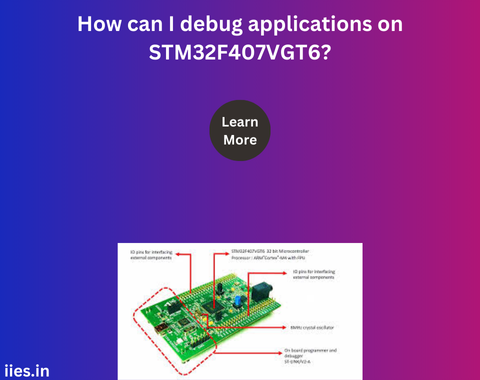
  • ST-LINK/V2 Debugger: A widely used in-circuit debugger/programmer for STM32 devices, offering compatibility with SWD and JTAG.

3. Debugging Techniques

Effective debugging involves various techniques that help developers identify and fix issues in their code. Here are some key approaches:

  • Breakpoints and Watchpoints:

    • Breakpoints allow developers to halt the execution of the program at specific points, enabling them to inspect the state of the system.
    • Watchpoints are similar but focus on monitoring changes in variable values, triggering when a variable is accessed or modified.
  • Step Execution:

    • Single Stepping: This involves executing one instruction at a time, which helps in understanding how the program progresses and identifying the point where it deviates from expected behavior.
    • Step Over: Executes the current line of code and moves to the next, skipping over function calls, which is useful for skipping over known working code sections.
  • Variable and Memory Inspection:

    • Inspecting variables and memory contents in real-time is crucial. IDEs typically provide a watch window where variables can be monitored. Memory view options allow direct inspection of memory contents, which can be essential for identifying issues in low-level code, such as pointer errors.
  • Real-Time Tracing:

    • Using the ETM or other trace features of the STM32F407VGT6, developers can perform non-intrusive tracing of program execution. This provides insights into the sequence of operations without halting the processor, which is particularly useful for time-sensitive applications.

4. Advanced Debugging Strategies

For more complex issues, advanced debugging strategies may be required:

  • RTOS-Aware Debugging:

    • If an RTOS (Real-Time Operating System) is used, RTOS-aware debugging tools can help by providing information about the state of tasks, queues, semaphores, and other RTOS objects. This is vital for diagnosing issues related to task scheduling, resource contention, or priority inversion.
  • Fault Analysis:

    • The STM32F407VGT6 provides features like fault status registers and hard fault handlers, which can be used to diagnose and recover from critical faults such as memory access violations or illegal instruction execution.
  • Using the ITM (Instrumentation Trace Macrocell):

    • ITM can be used to send diagnostic data, such as variable values or status messages, to a host computer in real-time, without halting the execution of the program.

5. Common Debugging Challenges

Even with robust tools and techniques, debugging on the STM32F407VGT6 can present challenges:

  • Intermittent Bugs: These are particularly difficult to trace, often requiring extensive logging or real-time trace capabilities to capture the exact conditions under which they occur.
  • Hardware-Related Issues: Problems related to the physical interface, such as unstable power supply or noise in communication lines, can manifest as software bugs, complicating the debugging process.

6. Best Practices for Efficient Debugging

To enhance debugging efficiency, developers should adhere to several best practices:

  • Modularize Code: Breaking down the application into smaller, independent modules can help isolate and identify issues more easily.
  • Use Assertions: Implementing assertions in the code can help catch bugs early by validating assumptions during runtime.
  • Document Known Issues: Maintaining a log of known issues and their resolutions can speed up the debugging process, especially in large projects or team environments.

Conclusion

Debugging applications on the STM32F407VGT6 requires a deep understanding of both the microcontroller’s architecture and the available debugging tools. By employing the techniques discussed in this article, developers can effectively troubleshoot and optimize their applications, leading to more robust and reliable embedded systems. While challenges will inevitably arise, a methodical approach to debugging will pave the way for successful development on the STM32F407VGT6 platform.